An authentication flow breaks at 11:47 PM on a Tuesday. Users attempting to log in receive a “resend OTP” prompt — and then another. Support tickets arrive around midnight. By 8 AM, an engineer reviews the SMTP relay logs and finds a clean record: every message accepted with a 250 OK response. No errors. No alerts. No queue backlog visible.
The messages were accepted by the sending infrastructure. They were greylisted for 22 minutes by the receiving server — long enough for every session token to expire. The failure was real and total. The monitoring system never triggered a single alert.
This is not an unusual failure mode. Transactional email systems fail silently, at the protocol layer, in ways that standard uptime monitors are architecturally incapable of detecting. A successful SMTP handshake is evidence that the sending server accepted the message — not that the user received it. Everything that happens after that handshake is invisible to simple port monitors and ping checks.
Operational Reality: A 250 OK from your SMTP relay is not a delivery confirmation. It is the beginning of a delivery process you can no longer observe — unless you have built the infrastructure to do so.
The most dangerous email failures are hidden behind successful SMTP acceptance logs.
Quick Answer: What Is SMTP Monitoring and Why Does Transactional Email Require It?
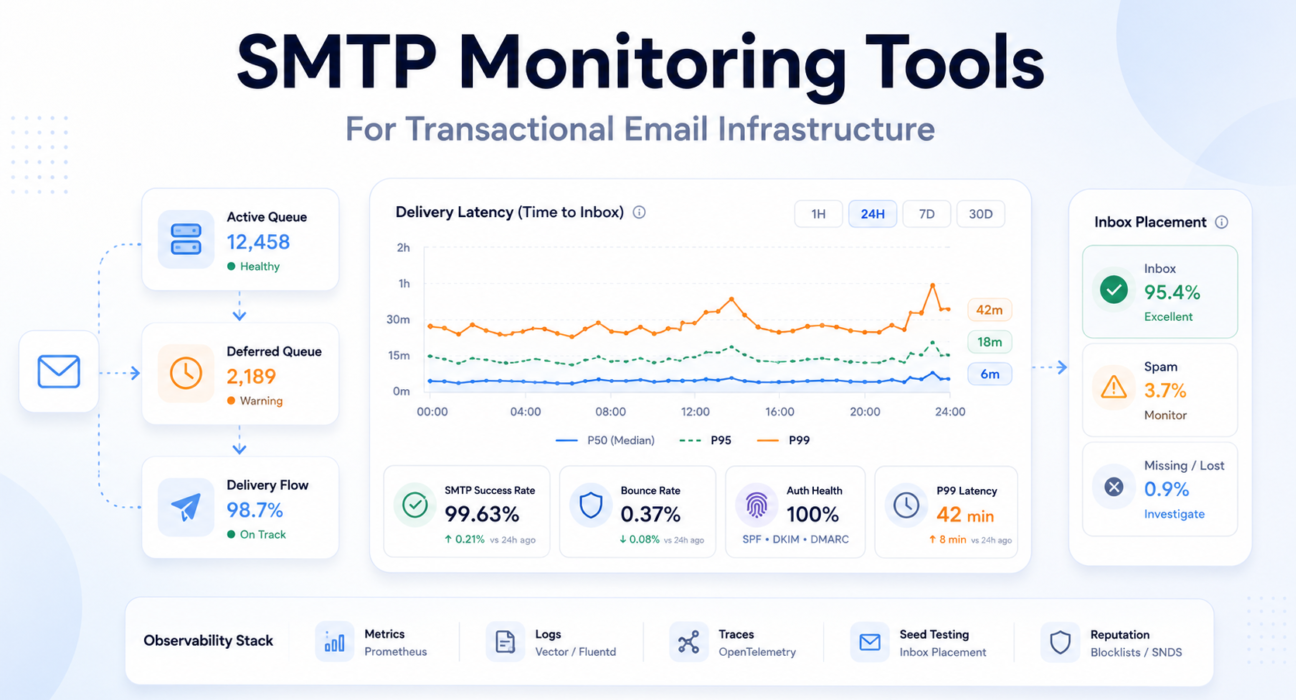
SMTP monitoring is the observability practice of tracking the full delivery lifecycle of email — from application generation through MTA queuing, SMTP handshake, ISP acceptance, and final inbox placement. Unlike port monitoring, which only confirms a server is reachable, production SMTP monitoring tracks the behavioral signals that determine whether messages actually reach users.
For transactional email specifically, monitoring must cover:
- Queue depth monitoring — tracking active, deferred, and incoming queue sizes as leading indicators of delivery latency and ISP-side throttling
- Delivery latency percentiles — measuring P95 and P99 time-to-inbox rather than averages, because tail latency determines authentication flow reliability
- Bounce rate analysis — differentiating hard bounces from soft bounces and monitoring trends rather than point-in-time values
- SMTP response code diagnostics — parsing enhanced status codes to distinguish greylisting from reputation blocks, policy rejections from address failures
- Authentication record monitoring — continuously verifying SPF, DKIM, and DMARC correctness, since authentication drift is one of the most common silent delivery failure vectors
- IP reputation tracking — monitoring blocklist status before reputation degradation produces visible delivery failures
- Inbox placement testing — using seed list mailboxes to verify that messages reach inboxes rather than spam folders, since spam routing produces no SMTP errors whatsoever
The core distinction: Simple SMTP monitoring tells you whether the mail server is running. Production observability tells you whether users are receiving the emails your system believes it successfully sent.
Why Transactional Email Systems Fail Silently
The SMTP protocol was designed for asynchronous, best-effort delivery. This architectural reality creates a monitoring gap that most standard approaches never close.
The Accepted-Does-Not-Mean-Delivered Problem
When a sending MTA receives a 250 OK from a receiving server, the message has been accepted for delivery — not delivered to the inbox. What happens next is entirely outside the sender’s visibility.
The receiving server queues the message, applies spam filter logic, evaluates the sender’s reputation, and decides: inbox, spam folder, greylist deferral, or silent discard. None of these outcomes produce a failure code the sending MTA can observe.
The relay log records a successful send. The monitoring dashboard shows no errors. The user never receives the email.
Accepted by SMTP server is not the same as delivered to inbox. Most transactional email monitoring systems conflate these two events.
Greylisting — Latency That Expires Before It Resolves
Greylisting returns a temporary 451 failure to an unrecognized sender, requiring retry after an interval. Legitimate MTAs queue the message and retry after 5 to 30 minutes. The message is eventually delivered.
But for a user waiting on an OTP with a 5-minute expiration window, a 15-minute greylist delay is functionally identical to a dropped message.
Reality Snapshot:
- 100,000 authentication emails per month
- 1% delayed beyond OTP expiry by greylisting
- = 1,000 failed login experiences per month
- SMTP log: all 100,000 marked as successfully delivered
ISP Throttling and the Black Friday Effect
ISPs lower their trust thresholds during peak traffic windows. A sender with historically clean reputation may find messages delayed by transient 421 or 451 responses — not because the sender did anything wrong, but because the receiving infrastructure is under aggregate load.
This pattern is most damaging during product launches and seasonal events — exactly when transactional email reliability is most critical. A sending system that ignores throttle signals and continues pushing volume escalates a temporary rate limit into a harder restriction.
Teams monitoring only average delivery time typically discover throttling events through user support tickets — the P99 delivery latency has been climbing for hours before the average shows any anomaly.
The 2024 Binary Rejection Shift
Beginning in early 2024, Google and Yahoo transitioned to binary rejection for non-compliant senders. Previously, messages failing SPF or DKIM authentication were routed to spam — a soft failure invisible to the sending MTA. Under the current mandate, these messages are rejected at the SMTP level with explicit 5xx permanent codes.
What were previously invisible deliverability failures now produce hard errors in relay logs. The underlying problem did not change. The visibility into it did — making SMTP log monitoring more valuable than it has ever been.
Authentication Drift — Silent Record Invalidation
Authentication drift occurs when SPF, DKIM, or DMARC records become invalid without any visible failure signal. It typically follows DNS changes, infrastructure migrations, or provider key rotations not synchronized with MTA configuration.
The records are syntactically valid. DNS lookups succeed. MTA configuration appears correct. But every message sent from the affected IP fails authentication validation at receiving ISPs — silently, until effects accumulate into visible delivery failures.
The SPF, DKIM, and DMARC configuration guide covers correct implementation. Continuous record validation — not one-time setup — is what prevents authentication drift from becoming a silent delivery crisis.
Queue Backpressure — Adjacent System Failures
Queue backpressure occurs when message generation rate exceeds delivery rate. The saturation can be caused by ISP throttling, network latency, or internal resource exhaustion — and critically, the bottleneck is often not in the MTA itself.
A documented production incident at a major email provider illustrates this precisely: database I/O saturation caused a spike in wait times, which slowed the processes responsible for picking up and sending queued messages. The MTA was functioning. The messages were not being sent. The failure was real; its cause was invisible to email-focused monitoring alone.
What this means: Queue depth is a leading indicator. Bounce rates are lagging indicators. Monitoring only one layer means discovering problems after they have already compounded.
For relay-level causes of this failure pattern, the emails sent but not delivered guide covers diagnosis and resolution paths.
What Modern SMTP Monitoring Actually Tracks
Production observability for transactional email spans multiple monitoring layers. Each captures a different class of failure signal. Missing any one of them creates a blind spot that specific failure patterns will consistently hide in.
Queue Depth Monitoring
Mail queue depth is the most important leading indicator in transactional email infrastructure. Unlike bounce rates — which confirm failures that already happened — queue depth is a real-time signal of impending latency before users experience it.
In Postfix-based systems, the key queues to monitor:
| Queue | Metric | Operational Meaning | Failure Signal |
|---|---|---|---|
| Active | postfix_queue_size{queue="active"} | Messages currently being delivered | Healthy when proportional to volume; sudden spike = burst load |
| Deferred | postfix_queue_size{queue="deferred"} | Messages waiting for retry after temporary failure | Growth without active queue growth = ISP throttling or external issue |
| Incoming | postfix_queue_size{queue="incoming"} | New messages entering from the application layer | Spike = application mail storm or retry amplification loop |
| Hold | postfix_queue_size{queue="hold"} | Messages quarantined pending review | Any non-zero value requires immediate investigation |
The queue diagnostic that separates mature teams from reactive ones: monitoring the ratio between deferred and active queues, not just their absolute sizes.
Queue State as Infrastructure Signal:
- Active ↑, Deferred stable → healthy high-volume sending
- Deferred ↑, Active flat → ISP throttling or external network degradation
- Both queues ↑ → internal MTA resource saturation
- Incoming ↑ without Active growth → application mail storm or retry loop
The remediation for ISP throttling and internal saturation is completely different. Monitoring the ratio makes the correct diagnosis possible.
Delivery Latency Monitoring
Average delivery latency is a dangerous abstraction for transactional email. Email latency follows a long-tail distribution — a small number of requests experience extreme delays while the majority complete quickly. The average is dominated by the fast majority and masks the slow tail entirely.
The tail latency of transactional email matters more than the average. P99 is the metric that determines authentication flow reliability — not P50.
Engineering teams should define SLOs based on latency percentiles. A production-grade threshold for transactional authentication email: P99 delivery latency under 10 seconds under normal operating conditions. Alerts should fire when P99 breaches this threshold — not when the average does.
Bounce Rate Analysis
Bounce rate is both a delivery health metric and a sender reputation signal. ISPs use bounce patterns as evidence of list quality — and they act on that evidence with delivery restrictions that compound over time.
- Hard bounces (5xx permanent): Remove immediately and automatically. Rates above 2% trigger provider reviews; above 5% risk account restrictions.
- Soft bounces (4xx transient): Monitor trend behavior. A transient 4xx that recurs across multiple retry cycles is effectively a hard bounce — the address is not receiving mail — but never produces the 5xx code that automated suppression systems catch without explicit retry tracking.
- Bounce rate velocity: The rate of change is often more diagnostically valuable than the absolute rate. A sudden spike indicates an event — list import, DNS change, IP reputation incident. A gradual increase over weeks indicates systemic degradation.
The email bounce rate reduction guide covers list management and bounce handling at production scale.
SMTP Response Code Diagnostics
The original SMTP specification provided approximately 12 response codes. RFC 3463 introduced Enhanced Status Codes with a three-part structure — class.subject.detail — giving automated systems machine-readable diagnostic information.
- 2.X.X (Success): Message accepted. No action required.
- 4.X.X (Transient Failure): Temporary condition. Retry is appropriate.
- 5.X.X (Permanent Failure): Terminal error. Retrying without modification is prohibited — and worsens sender reputation without any chance of delivery.
Monitoring systems that do not parse enhanced status codes cannot differentiate between a greylisting event (451 4.7.1 — retry in 10 minutes) and a policy block (550 5.7.1 — review authentication records immediately). These require completely different operational responses. The complete reference is covered in the SMTP response codes guide.
Authentication Record Monitoring
Authentication records must be monitored continuously — not just at setup. They become invalid when DNS configurations change without updating SPF sending IP ranges, when providers rotate DKIM keys without corresponding DNS updates, or when new sending services are added outside existing authentication coverage.
Authentication drift monitoring should include: periodic DNS trace tests verifying record correctness against current sending infrastructure, DKIM signature validation against the active key set, and DMARC alignment testing across all sending domains.
IP Reputation and Inbox Placement Monitoring
Reputation changes are gradual and cumulative. By the time degradation produces visible delivery failures, underlying signals have been accumulating for days or weeks. Proactive monitoring requires:
- Regular blocklist checks against Spamhaus SBL, Barracuda, and SpamCop
- Weekly review of Google Postmaster Tools domain and IP reputation data
- Weekly review of Microsoft SNDS for Outlook delivery signals
Inbox placement monitoring — verifying whether messages reach the inbox or spam folder — requires seed list testing. A seed list of test mailboxes across major ISPs, checked automatically after each send, is the only approach that detects spam folder routing. From the sending infrastructure’s perspective, spam-foldered messages are successfully delivered. Only a check of the actual destination mailbox reveals the failure.
A spam-foldered OTP is operationally indistinguishable from a failed OTP. Neither reaches the user. Only one appears as a delivery failure in relay logs.
Incident Snapshot: OTP Delivery Failure During ISP Throttling
The following describes a realistic failure pattern observed in SaaS authentication infrastructure during a product launch event. No single SMTP error was ever generated.
What happened: A product team launched a new feature on a Wednesday afternoon, driving a 3x spike in user sign-ins and OTP sends. Volume crossed 8,000 emails per hour — above the team’s typical sending rate and above the trust threshold that the receiving ISP applied to their sending IP pool.
What the infrastructure showed: The deferred queue began growing at 14:22. The active queue remained stable. No hard bounces. No 5xx responses. SMTP logs showed clean acceptance codes for all messages — the ISP was accepting messages and deferring internal delivery, not rejecting at the protocol level.
What users experienced: OTP delivery latency climbed from a typical P99 of 4 seconds to over 8 minutes by 14:45. Users on mobile networks with shorter session timeouts began experiencing authentication failures. Support tickets began arriving at 15:10 — 48 minutes after the deferred queue first started growing.
What the monitoring missed: The team had alerts on bounce rate and hard SMTP failures. Neither triggered. The deferred queue growth — a leading indicator available in Postfix metrics for the full 48 minutes before users reported problems — was not being monitored.
The diagnostic signal that would have caught it: A Prometheus alert on deferred queue growth relative to active queue size, configured to fire when the ratio exceeds 20% for more than 10 consecutive minutes, would have triggered within 8 minutes of the throttling event — 40 minutes before the first support ticket.
Operational Lesson: Most SMTP incidents begin as latency problems before they become delivery failures. Queue ratio monitoring catches the problem while it is still a latency event — not after it has become a user experience crisis.
SMTP Failure Patterns in Production
Production email systems degrade in non-linear, often delayed ways. Understanding named failure patterns — their symptoms, causes, and detection signals — is what allows engineering teams to move from reactive log parsing to proactive infrastructure alerting.
Queue Backpressure — The Compounding Delay
Backpressure begins when message generation rate exceeds delivery rate. Messages move from active to deferred queue. As the deferred queue grows, recently generated messages must wait behind earlier deferred messages during retry cycles — creating a compound latency effect where a message generated at T+0 may not be delivered until T+8 minutes simply because of queue depth ahead of it.
Queue growth is usually a symptom. The real failure exists upstream at the ISP, or downstream in the supporting infrastructure.
Teams that experience this pattern for the first time during a product launch typically discover the monitoring gap at the same moment they discover the incident. The email delivery delay diagnosis guide covers infrastructure-level root cause analysis.
Greylisting — The Invisible Latency Event
Greylisting is operationally deceptive: the SMTP log records a 451 temporary failure, followed eventually by a 250 success after retry. From the relay’s perspective — delivery succeeded. From the user’s perspective — the OTP arrived 22 minutes late and the session had expired.
Detecting greylisting requires tracking the time dimension of delivery events, not just their eventual outcome. A message that succeeds after a 20-minute retry cycle has failed its operational purpose for any authentication use case, regardless of what the delivery event log records.
The Black Friday Effect — Peak Demand Throttling
During high-traffic periods, ISPs lower trust thresholds across all senders. A product launch that increases both transactional email volume and ISP filtering pressure simultaneously is the worst context for a degraded-reputation sending infrastructure.
Monitoring that uses normal-traffic baselines for alert thresholds cannot automatically identify degradation during peak periods. Alerting must account for expected volume increases during launch windows — and should be configured to fire on queue depth ratios rather than absolute values that only make sense at typical volume.
Shared IP Reputation Contamination
On shared IP infrastructure, reputation is a pooled resource. A co-tenant with poor list hygiene or aggressive sending behavior degrades the reputation of every sender on that IP — including teams whose own practices are entirely clean.
Shared IP infrastructure transfers reputation risk between unrelated companies. Your sender score is a function of your neighbors as much as your own behavior.
Monitoring can detect the symptom — rising deferred queue depth, increasing bounce rates, blocklist presence — but cannot prevent the cause without moving to dedicated IP infrastructure. At volumes above 50,000 emails per month, this is the primary argument for dedicated IPs: reputation control, not cost.
Authentication Drift in Practice
Authentication drift typically surfaces in predictable scenarios: a DNS administrator updates SPF records for a new tool and accidentally removes a CIDR range covering the transactional relay’s sending IPs; a relay provider rotates DKIM keys without notifying customers to update DNS selectors; a microservice migration adds a service that sends from the same domain through a new IP range not in existing authentication records.
In each case, the mismatch is between authentication records and current sending infrastructure — a gap that produces systematic delivery failures without any error in either the DNS configuration or the MTA configuration alone. Continuous validation catches this before it accumulates into visible failures.
Delivery Latency and Time-to-Inbox
For transactional email, successful delivery is time-bounded. A notification that arrives after its relevance has expired is operationally equivalent to a message that was never sent.
A password reset arriving after token expiration is functionally equivalent to a failed delivery.
Why Average Latency Is Misleading
Consider a system where 95% of OTPs are delivered in under 3 seconds and 5% are delayed by greylisting for 18 minutes. Average delivery time: approximately 55 seconds — which appears acceptable in a dashboard.
But 5% of users are experiencing an authentication failure. At 10,000 daily authentication events, that is 500 failed logins per day. Zero of these produce an SMTP error that standard monitoring would catch.
Latency Distribution Model:
- P50 (Median): The typical delivery experience. Baseline performance floor.
- P95: The experience of the majority of “slow” deliveries. Right threshold for operational latency alerting.
- P99: Tail latency. For OTP email — if P99 exceeds the token expiration window, the system is failing users even if P50 looks healthy.
Configure SLO alerts on P99, not average. Average latency will not catch the tail events causing real authentication failures.
Measuring True Time-to-Inbox
True time-to-inbox measurement requires instrumentation across the full delivery pipeline — not just the relay handoff. With OpenTelemetry distributed tracing, each stage can be measured as a span:
- Application span: Time from event trigger to message handoff to the notification service
- Queue span: Time in the message broker before MTA pickup
- MTA span: Time in the Postfix queue before first send attempt
- Upstream span: Time taken by the relay provider or ISP to accept the message
- Retry spans: Cumulative time added by greylist intervals and throttle backoffs
Trace-based root cause analysis identifies exactly which stage is responsible for a delay — distinguishing application serialization lag from MTA resource saturation from ISP-side throttling. Without this instrumentation, delay diagnosis defaults to log parsing across multiple systems, which is slow and often inconclusive.
The SMTP Monitoring Tool Ecosystem
Production SMTP observability is not a single-tool problem. It is an integrated architecture spanning four distinct layers — each covering failure classes the others cannot see.
Observability Layer Model:
- Metrics (Prometheus + Grafana): Queue depth, message rates, latency percentiles, rejection counts
- Logs (Vector or Fluentd): Per-message SMTP response codes, retry events, delivery outcomes
- Traces (OpenTelemetry): End-to-end delivery lifecycle, stage-by-stage latency attribution
- Synthetic testing: SMTP port availability, TLS certificate validity, EHLO handshake correctness
- Seed list testing: Inbox placement verification — the only layer that detects spam folder routing
- Reputation monitoring: Blocklist status, ISP reputation dashboards, complaint rate feeds
Metrics: Prometheus and Grafana
Prometheus has become the industry standard for time-series metric collection in infrastructure observability. For Postfix-based relay systems, the prometheus-postfix-exporter parses logs and queue directories to expose queue depth, message rate, and connection metrics that Prometheus scrapes on a regular interval.
Grafana provides the visualization layer. A well-architected email infrastructure dashboard integrates mail metrics with system-level data — CPU utilization, disk I/O wait, RAM — because delivery failures frequently originate in adjacent system components. Key panels: message rate by outcome (delivered, deferred, rejected), queue depth by queue type with threshold color bands, rejection breakdown by category, and P99 latency tracked over rolling windows.
Alerting rules in Prometheus should trigger on queue depth ratios relative to baseline, P99 latency percentile breaches, and rejection rate spikes by category — not on hard threshold values that lose meaning as volume changes.
Logs: Vector vs Fluentd
Mail logs are the highest-resolution source of diagnostic truth in SMTP systems. Every transaction produces log entries covering connection establishment, EHLO handshake, acceptance or rejection, response codes, and retry scheduling. At production volume, these logs require high-performance parsing infrastructure.
Vector — written in Rust — benchmarks at processing up to 143,000 log events per second, significantly outperforming Ruby-based collectors like Fluentd at high throughput. Vector’s Remap Language (VRL) transforms unstructured Postfix log lines into typed JSON events with consistent schema. For teams running high-volume relay infrastructure where log volume is significant, Vector’s throughput advantage is operationally meaningful.
Fluentd, while slower at scale, offers the most extensive plugin ecosystem. For teams needing to ship logs to niche or proprietary endpoints, or teams with existing Fluentd infrastructure not in a position to replace, Fluentd remains viable. The trade-off is throughput capacity versus integration breadth.
Distributed Tracing: OpenTelemetry
OpenTelemetry provides the instrumentation framework for end-to-end delivery lifecycle tracing. By adding OTel spans at each stage of the email generation and delivery path, engineers can pull the specific trace for a message that experienced extreme latency and see exactly which span accounts for the delay.
This is a fundamentally different diagnostic approach from log parsing. Instead of searching across multiple log sources for error patterns, the latency attribution is embedded in the trace data — immediately locating whether the bottleneck is application-layer serialization, message broker queueing, MTA processing, or ISP-side retry waiting.
Synthetic SMTP Testing
Synthetic probes verify infrastructure availability: port accessibility on 25, 587, and 465; valid 220 server banner; correct EHLO processing; TLS certificate validity and expiration; STARTTLS functionality.
Synthetic testing reliably detects hard infrastructure failures — server down, port unreachable, certificate expired, firewall misconfiguration. It is blind to deliverability issues, spam folder routing, and the latency patterns that affect time-to-inbox. Its role is infrastructure availability verification, not delivery quality assurance.
The SMTP testing methods guide covers both synthetic and functional testing approaches in detail.
What High-Maturity Teams Monitor Differently
The difference between reactive email operations and engineered email reliability is not the presence of monitoring. It is what is monitored, how alerts are calibrated, and how operational posture is maintained between incidents.
SLOs for Email Delivery
High-maturity infrastructure teams define Service Level Objectives for transactional email and treat violations as production incidents. A production SLO framework might define:
- Transactional Core SLO: P99 delivery latency under 10 seconds for authentication-critical email
- Delivery Success SLO: Hard bounce rate below 1% across all sending domains
- Complaint Rate SLO: Complaint rate below 0.08% — well below ISP enforcement thresholds
- Inbox Placement SLO: Seed list inbox placement above 95% across major ISPs
SLOs make email reliability measurable, prioritizable, and incident-triggerable. Without them, email delivery problems compete for engineering attention against other priorities based on urgency — and email delivery problems are often slow-moving enough that they accumulate for weeks before reaching urgency threshold on their own.
Alert Thresholds: Ratios Over Absolutes
Sophisticated teams alert on ratios and rates of change rather than absolute values. A deferred queue of 500 messages is concerning in a system processing 2,000 emails per hour. It is minor variation in a system processing 50,000.
- Ratio-based queue alerting: Alert when deferred queue exceeds N% of active queue — not when it exceeds a fixed message count
- Rate-of-change bounce alerting: Alert when bounce rate increases by more than 0.5 percentage points in 24 hours — not just when it exceeds an absolute threshold
These patterns produce alerts that are meaningful relative to current operating conditions — not calibrated to a historical baseline that may no longer reflect the system’s actual state.
Monitoring-as-Code
Monitoring coverage should evolve with the infrastructure it monitors. Prometheus alerting rules defined in YAML, version-controlled, and automatically deployed. CloudWatch alarms for SES bounce and complaint rates provisioned via Terraform. Synthetic test definitions updated as part of feature release pull requests.
When a new sending domain is added, monitoring is updated in the same deployment. When a new authentication record is configured, the continuous validation test is updated simultaneously. The alternative — manual monitoring configuration that lags behind infrastructure changes — is exactly how authentication drift creates monitoring gaps that persist until a user-visible incident surfaces them.
IP Warming as a Monitored Protocol
IP warming is not best-effort volume ramping. It is a structured process with specific monitoring requirements at each phase:
| Phase | Daily Volume | ISP Trust Level | Required Monitoring |
|---|---|---|---|
| Phase 1 (Days 1–5) | Under 1,000 | New / Untrusted | Greylist rate, 4xx deferral rate, blocklist status |
| Phase 2 (Days 6–14) | 1,000 – 10,000 | Emerging | Open rates, bounce rates, complaint rates, throttle signals |
| Phase 3 (Days 15–30) | 10,000 – 50,000 | Trusted | Seed list inbox placement across major ISPs, Postmaster Tools reputation |
| Phase 4 (Continuous) | 50,000+ | Production | Full SLO-based alerting, reputation dashboards, weekly SNDS review |
The absence of hard errors during early warmup phases does not indicate healthy performance. It indicates that volume is too low for ISPs to have formed strong reputation signals. The problems appear when volume increases.
Why Many Teams Miss Deliverability Failures
Deliverability failures are not binary, not immediate, and not correlated with the error signals that engineering teams are trained to treat as reliability indicators. This is precisely why they accumulate undetected.
SMTP Success Codes Masking Downstream Failure
A 250 OK response from a receiving server means the server has accepted responsibility for the message — not that it delivered it to the inbox. What happens inside the receiving infrastructure produces no further SMTP communication visible to the sender.
An SMTP server accepting a message successfully does not guarantee inbox placement. It guarantees that the server received the message and is responsible for its disposition — whatever that turns out to be.
Teams monitoring only SMTP response codes see a clean delivery record for messages simultaneously being routed to spam folders or silently discarded by ISP-side filtering. Their monitoring shows 100% delivery success. Their users are not receiving emails.
Spam Placement Invisibility
Spam folder routing generates the identical SMTP response as inbox delivery: 250 OK, delivery event complete, relay log shows success. The only detection method is checking the actual destination mailbox via seed list testing.
Most deliverability degradation begins with spam folder routing before progressing to active throttling and blocking. Teams that catch reputation problems only when throttling begins have already missed weeks of user-visible delivery failures.
The Compounding Visibility Window
Reputation degradation that begins in week one may not produce measurable bounce rate changes until week three, and support ticket volume spikes until week four. By the time the problem is visible in any metric that reactive monitoring would catch, the cause has been active long enough to require significant remediation effort.
Most deliverability failures become visible to customers before engineering teams detect them. Users discover the problem through failed authentication. Engineers discover it through support ticket volume.
The correct response is proactive monitoring — Postmaster Tools review, seed list testing, reputation dashboard checks on a regular cadence — rather than reactive monitoring that waits for visible failure signals before investigation begins. The email deliverability improvement guide covers both preventive practices and remediation approaches.
Infrastructure Complexity Hiding Failure Origins
In microservice architectures, email generation involves multiple services: event producer, message broker, notification service, MTA, upstream relay provider. A delay in any stage produces the same user-visible symptom — a delayed email — but requires a completely different investigation.
Without distributed tracing, teams default to investigating the most recently modified system or the most visible component. The result is investigating the relay provider when the problem is in the message broker, or investigating the MTA when the bottleneck is application-layer serialization. The SMTP connection timeout debugging guide covers connection-level failures that are frequently misattributed to other system components.
How PhotonConsole Approaches Reliability
The core operational problem in transactional email infrastructure is not sending capacity. Most relay platforms can handle volume. The problem is visibility — knowing not just whether a message was accepted, but what happened to it afterward.
PhotonConsole’s SMTP relay is designed for the delivery characteristics that transactional email requires: queue prioritization and retry logic oriented toward OTP latency requirements rather than bulk throughput, and delivery event logging that provides SMTP response codes, delivery timestamps, and failure reasons at the message level.
This operational transparency — knowing not just whether a message was accepted, but what response code it received, how many retry attempts occurred, and at which stage delivery failed — is what allows incident response to resolve in minutes rather than hours of log correlation across multiple systems.
For teams evaluating relay infrastructure at production scale, the SMTP relay evaluation guide covers the infrastructure variables that distinguish purpose-built transactional relays from general-purpose platforms at operational volume.
Best Practices for SMTP Infrastructure Monitoring
- Monitor queue latency, not just queue size. How long messages have been in the deferred queue is more actionable than how many are there. Messages deferred over 30 minutes indicate persistent throttling or routing problems — not normal retry cycles.
- Track bounce rate velocity, not just absolute rate. A sudden spike indicates an event. A gradual increase over weeks indicates systemic degradation. Both require investigation, but with different urgency and completely different root cause approaches.
- Validate SPF, DKIM, and DMARC records continuously. Authentication drift is silent. Run DNS trace validation against current sending infrastructure at minimum daily, and on any change touching DNS, relay configuration, or sending IP ranges.
- Alert on deferred queue growth as an ISP throttling signal. Configure alerts on the deferred-to-active queue ratio, not total queue size. The ratio catches throttling events that absolute thresholds calibrated to typical volume will miss entirely.
- Alert on P99 latency breaches — not average latency. Average latency will not catch tail latency events causing real authentication failures for a meaningful percentage of users.
- Separate transactional and marketing traffic architecturally. Different sending domains, IP pools, relay configurations, and reputation monitoring for each traffic class. A reputation problem in marketing cannot contaminate the infrastructure your authentication emails depend on.
- Integrate seed list testing into CI/CD pipelines. Run inbox placement checks before infrastructure changes are deployed to production. This catches deliverability regressions before users do — which is the definition of proactive monitoring.
- Implement automated failover for well-understood failure modes. Throttling events, blocklist listings, and primary provider outages are predictable failure modes. Automated runbooks that switch to a secondary relay provider when primary error rates exceed a threshold reduce mean time to recovery from hours to minutes.
SMTP Monitoring Reference Tables
SMTP Failure Diagnostics Matrix
| SMTP Code | Enhanced Code | Diagnostic Meaning | Operational Response |
|---|---|---|---|
| 421 | 4.4.2 | Connection dropped — receiving server timed out | Investigate network latency and receiving server load; check for rate limiting signals |
| 451 | 4.7.1 | Greylisted — receiving server delaying first delivery | Verify retry logic and exponential backoff; track time-to-delivery after retry |
| 452 | 4.2.2 | Mailbox temporarily full | Retry after interval; escalate to hard bounce if persistent after 24 hours |
| 550 | 5.1.1 | Address invalid — mailbox does not exist | Remove immediately from active lists; audit application-level address validation |
| 550 | 5.7.1 | Policy rejection — SPF/DKIM failure or spam score | Audit authentication records; check content against spam scoring tools |
| 554 | 5.7.0 | Reputation block — sending IP on blocklist | Check Spamhaus SBL and major DNSBLs; initiate delisting; review sending hygiene |
Monitoring Coverage Summary
| Monitoring Area | Why It Matters | Alert Threshold |
|---|---|---|
| Queue depth ratio (deferred/active) | Leading indicator of ISP throttling before latency becomes user-visible | Deferred exceeds 20% of active for more than 10 minutes |
| P99 delivery latency | Identifies tail events causing auth failures without affecting averages | P99 for authentication email exceeds OTP expiration window |
| Bounce rate velocity | Detects list hygiene events and reputation degradation early | Rate increases by more than 0.5 percentage points in 24 hours |
| Authentication record validity | Prevents authentication drift from creating silent delivery failures | Any DNS trace test returning non-pass for SPF, DKIM, or DMARC |
| IP reputation / blocklist status | Early warning of reputation events before delivery failures appear | Any listing on Spamhaus SBL, Barracuda, or SpamCop |
| Inbox placement (seed list) | Only metric that detects spam folder routing | Inbox placement below 90% at any major ISP |
| Complaint rate | ISP uses this to determine sender trust level and filtering aggressiveness | Rate exceeds 0.08% — below the 0.1% ISP enforcement threshold |
Frequently Asked Questions
What is SMTP monitoring?
SMTP monitoring is the practice of observing the full lifecycle of email delivery — from application generation through MTA queuing, SMTP protocol handshake, ISP acceptance, and inbox placement. In its simplest form, it verifies that an SMTP server is reachable on the correct port. In its production-grade form, it tracks queue depth, delivery latency percentiles, SMTP response code patterns, authentication record validity, sender reputation, and inbox placement via seed list testing. The gap between those two definitions is where most transactional email failures hide.
What are the best SMTP monitoring tools for transactional email?
Production SMTP monitoring requires a layered stack: Prometheus with prometheus-postfix-exporter for time-series queue and throughput metrics; Grafana for correlated visualization; Vector or Fluentd for high-throughput log aggregation; OpenTelemetry for distributed tracing across the full delivery pipeline; seed list testing tools for inbox placement verification; and Google Postmaster Tools plus Microsoft SNDS for ISP-side reputation signals. Each layer covers failure classes the others cannot detect.
How do I monitor transactional email delivery in production?
Start with leading indicators: deferred-to-active queue ratio monitoring, continuous authentication record validation, and P99 latency alerting against your OTP expiration window. Add lagging indicators: bounce rate trending and complaint rate monitoring. Finally, add invisible indicators: regular seed list inbox placement testing integrated into your CI/CD pipeline. This three-layer approach catches failures at the earliest possible stage — before they compound into user-visible incidents.
Why do emails fail silently without SMTP errors?
Silent failures occur because the SMTP protocol confirms message acceptance, not delivery or inbox placement. A receiving server that accepts a message with 250 OK and then routes it to spam, greylists it, or silently discards it has behaved correctly from a protocol perspective. None of these downstream outcomes produce a failure code the sending MTA can observe. Detecting them requires inbox placement monitoring, latency percentile tracking, and reputation monitoring — not just SMTP response code analysis.
What is SMTP delivery latency and why does it matter?
SMTP delivery latency is the time between message generation and inbox placement. For transactional email, this time dimension is critical: OTP tokens expire, password reset links time out, session tokens become invalid. A message delivered 22 minutes after generation has failed its operational purpose for any authentication use case — even if the relay log records it as successfully delivered. Monitor P99 latency, not averages. Tail latency is what determines whether authentication flows succeed for every user, not just the majority.
What is email deliverability monitoring and how is it different from SMTP monitoring?
SMTP monitoring tracks the protocol-layer behavior of sending infrastructure — server availability, response codes, queue health. Deliverability monitoring tracks the outcome layer — whether messages reach inboxes or spam folders, what ISPs think of sender reputation, and whether bounce and complaint rates are within acceptable ranges. Both are necessary. SMTP monitoring catches infrastructure failures. Deliverability monitoring catches the failures that infrastructure monitoring cannot see.
Conclusion: Transactional Email Is Production Infrastructure
The monitoring gap in transactional email infrastructure is not a tooling gap. The tools exist. The gap is conceptual — the persistent treatment of email delivery as a notification utility rather than as production infrastructure requiring the same observability rigor as a database, API, or authentication service.
When an OTP fails to arrive within a user’s session window, the user cannot authenticate. When a password reset email is routed to spam, the user cannot regain account access. These are not failures of a notification system. They are production failures in a system that directly controls user access and onboarding completion.
Production infrastructure gets SLOs. It gets distributed tracing. It gets leading-indicator alerting on queue ratios and latency percentiles. It gets continuous authentication record validation. It gets proactive reputation monitoring. It gets inbox placement testing in CI/CD pipelines.
The failures that happen in the gap between utility monitoring and production monitoring are not random. They are predictable, detectable, and preventable — by teams that have built the observability stack to see them before users do.
SMTP acceptance logs are often the least useful definition of successful delivery. A 250 OK means the relay accepted the message — not that the user received it. Building monitoring around the protocol handshake is building it around the wrong success signal.
If you are evaluating SMTP relay infrastructure that provides delivery event visibility and operational transparency at the level this guide describes, PhotonConsole is built around exactly these reliability and observability principles. For teams approaching significant transactional volume, the scaling guide for 100,000 monthly transactional emails covers the infrastructure and cost decisions that determine what email reliability costs at production scale.
Recommended Infrastructure Guides
Debugging and Diagnosis
- SMTP response codes — complete reference and remediation guide
- Email delivery delays — infrastructure-level diagnosis
- Emails sent but not delivered — relay-level causes and resolution
Deliverability and Authentication
Scaling and Infrastructure