
A user requests a login OTP on their phone. They wait 8 seconds. Then 20. Then 45. They tap “resend.” By the time the first OTP arrives — 4 minutes after the initial request — the authentication session has expired. The second OTP arrives 3 minutes after that. Neither works. The user closes the app.
The relay dashboard shows 100% delivery success. No SMTP errors. No queue alerts. No bounce events. Every system appears healthy. The authentication flow failed completely.
This is the specific thing that makes email latency operationally dangerous: it hides behind delivery success metrics. The relay handed the message to the receiving server. That happened. What it does not record is whether the message was useful when it arrived.
Operational observation: Many SMTP dashboards measure relay success, not user success. The gap between those two measurements is where latency problems live undetected.
Table of Contents
- Quick Answer: What Is Transactional Email Latency?
- What Transactional Email Latency Actually Means
- Why Latency Matters in SaaS Applications
- Most Common Causes of Transactional Email Latency
- P50 vs P95 vs P99 Latency — What Teams Misunderstand
- How to Measure Email Latency Properly
- Why SMTP Success Metrics Can Be Misleading
- Observability and Monitoring Best Practices
- Incident Snapshot: OTP Failure During Traffic Spike
- How PhotonConsole Reduces Latency Risk
- Email Latency Monitoring Checklist
- Frequently Asked Questions
- Conclusion
Quick Answer: What Is Transactional Email Latency?
Transactional email latency is the elapsed time between when an email is generated by the application and when it appears in the recipient’s inbox. Not when the relay accepts it. When it arrives and is readable.
In production systems, that time spans multiple stages: application queue wait, MTA processing, SMTP relay transit, DNS MX resolution, ISP-side filtering, and any retry delays from transient 4xx responses. Each stage adds independently. A delay at any stage produces the same symptom — an email that arrives too late to be useful — regardless of which system caused it.
The correct production measurement is P99 delivery time, not average. For OTP email, if P99 exceeds the token expiration window, the system is producing authentication failures for a portion of users — regardless of what the delivery success rate shows.
What Transactional Email Latency Actually Means
SMTP acceptance time is what relay dashboards measure: the gap between message submission and receiving server acknowledgment. Inbox arrival time is what determines whether the email was useful. The distance between those two measurements is where most production latency problems live.
A relay can report a 1.2-second average acceptance time while messages spend an additional 6 minutes inside the receiving server’s processing queue before reaching the inbox. That delay is invisible to the relay and invisible to the sending application. From the relay’s perspective, the message was delivered in 1.2 seconds. From the user’s perspective, the OTP arrived 7 minutes late.
SMTP acceptance time and inbox arrival time are not the same metric.
The Full Delivery Pipeline
Transactional Email Delivery Pipeline:
- Application event trigger (login, signup, password reset)
- → Message generation and serialization
- → Application-level message broker queue
- → Queue worker pickup and MTA handoff
- → SMTP relay authentication and processing
- → DNS MX resolution for recipient domain
- → SMTP connection to receiving mail server
- → ISP spam filtering and reputation evaluation
- → Inbox or spam folder placement
A delay at any stage looks identical to users: an email that arrives too late.
Time-Bounded Transactional Email
OTP tokens expire in 5 to 10 minutes. Password reset links expire in 15 to 60 minutes. Onboarding confirmation windows close when users lose interest or navigate away.
There is no meaningful concept of “eventually delivered” for authentication flows. An OTP that arrives at minute 12 to a 10-minute window is not slow — it is broken.
Why Latency Matters in SaaS Applications
For most infrastructure components, latency degrades experience quality. For transactional email in authentication flows, latency determines whether the product functions at all.
OTP and MFA Flows
Users abandon OTP flows when email delivery exceeds 30 to 60 seconds. Research on authentication UX is consistent here. A P99 delivery time of 3 minutes — which looks excellent in a delivery metrics dashboard — means that at 10,000 OTP sends per month, roughly 100 users per month are waiting long enough to abandon or attempt multiple resends.
The resend button makes this worse. A user who taps “resend” during a queue congestion event adds a new message to an already-backed-up queue. Both OTPs will arrive after expiry. The duplicate now contributes additional queue pressure. Tail latency usually appears before outright delivery failure, and the resend behavior often precedes engineers noticing anything wrong at all.
Password Reset
A user attempting account recovery is already frustrated. A password reset that takes 5 minutes converts a manageable inconvenience into a trust incident. A link that arrives after its token has expired creates an account lockout that requires support intervention. These are disproportionately likely to generate negative reviews — the experience is specific and memorable in a way that most product failures are not.
Onboarding Confirmation
Product activation research consistently identifies first-session completion as one of the strongest predictors of long-term retention. A confirmation email delayed 10 minutes arrives after the user’s initial engagement window has closed. The effect on trial-to-paid conversion rates is real and almost never attributed to email infrastructure — it shows up in funnel data as “drop-off between signup and first action” with no obvious cause.
Most Common Causes of Transactional Email Latency
Queue Congestion
Application-level queue congestion is the most common latency source that does not originate in the relay or ISP. The queue was healthy from the relay’s perspective because the relay never saw the messages.
The math compounds quickly. If workers process 20 messages per minute and the queue has 340 messages when an OTP is generated, that OTP waits 17 minutes before a worker attempts SMTP delivery. The relay delivers it in under 2 seconds. Total latency: 19 minutes. SMTP success metrics: perfect.
Engineering Snapshot:
- Worker capacity: 20 messages per minute
- Queue depth at OTP generation: 340 messages
- OTP queue wait: 17 minutes
- OTP token expiry: 5 minutes
- SMTP delivery time: 1.8 seconds
- Total delivery latency: 19 minutes — zero SMTP errors
Queue congestion is entirely invisible in relay metrics. Detection requires application-level monitoring: worker pickup latency, queue depth per priority class, job age for messages waiting in queue. Most teams add this monitoring only after encountering the incident.
SMTP Provider Throttling
When sending volume exceeds relay rate limits, the provider returns 4xx temporary failures and messages move to the deferred queue. If retry logic uses fixed intervals rather than exponential backoff, all deferred messages retry simultaneously — holding the rate limit exceeded and preventing the queue from clearing.
Retry logic amplified the incident instead of recovering from it. A traffic spike that should self-resolve in 10 minutes can sustain degraded delivery for 90 minutes because the retry pattern is perpetually re-triggering the rate limit.
Engineering Snapshot — Retry Storm:
- Provider rate limit: 200 messages per minute
- Peak rate during event: 380 messages per minute
- Retry interval: fixed 60 seconds
- Effect: all 340 deferred messages retry simultaneously every 60 seconds
- Duration: rate limit held exceeded for 85 minutes after traffic normalized
DNS Resolution Delays
Each delivery requires MX record lookup for the recipient domain. Under normal conditions this is 50 to 200 milliseconds — negligible. It becomes relevant when: a new deployment resets the DNS cache, forcing cold-resolution for every recipient domain; or a large simultaneous send reaches thousands of unique domains, each requiring a separate lookup.
Not usually a primary latency cause, but worth checking when latency spikes appear immediately after a deployment or a large campaign send.
Greylisting and ISP Filtering
Greylisting returns a temporary 451 failure from receiving servers that do not recognize the sender, requiring retry after 5 to 30 minutes. The message eventually delivers — but with a latency penalty equal to the greylist deferral window plus retry wait time. For an OTP with a 5-minute expiry, that is always a functional failure.
ISP-side filtering delays add similar latency after SMTP acceptance — the receiving server accepts the message but holds it in internal processing before routing to inbox. This delay is invisible to the sending MTA and invisible to relay dashboards. It only shows up if you are tracking the gap between SMTP acceptance time and seed list inbox arrival time.
Shared Infrastructure Contention
On shared relay infrastructure, a co-tenant sending a large bulk campaign consumes available outbound connection slots. New connections from other tenants queue for capacity. The affected sender sees elevated latency that does not correlate with their own traffic — which makes diagnosis harder because the obvious starting points (own queue depth, own rate limits) look normal.
Most queue incidents begin upstream of the relay. Not all of them.
Poor Retry Configuration
Two specific misconfigurations consistently cause latency problems:
- Retry intervals too long for OTP priority class: A universal 4-hour retry interval applied to OTP delivery means a single transient 4xx failure produces a 4-hour delivery delay. Priority-class retry configuration — 30-second retries for OTPs, 4-hour retries for campaigns — is the fix.
- Maximum retry window too long: Soft bounces with a 48-hour retry window continue consuming queue resources for messages that are unlikely to deliver. They add to queue congestion without contributing to eventual delivery rates. Cap retry windows per email priority class.
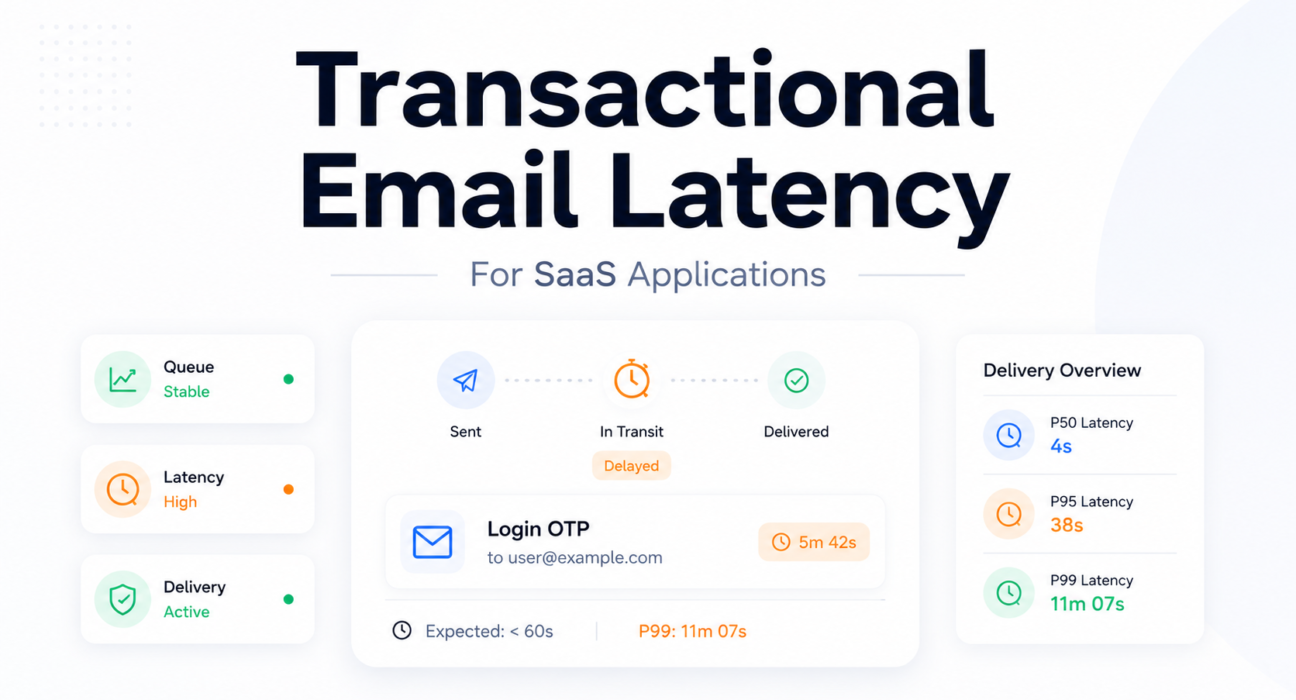
P50 vs P95 vs P99 Latency — What Teams Misunderstand
Average delivery latency is the number most relay dashboards show. It is also the least useful number for understanding whether transactional email is reliable.
Email latency does not follow a normal distribution. The fast majority delivers in seconds. A small minority hits greylisting, throttling, or queue backpressure and experiences delays measured in minutes. The average is dominated by the fast majority and masks the slow minority entirely.
Latency Distribution Example:
| Percentile | Delivery Time | Implication |
|---|---|---|
| P50 | 4 seconds | Typical experience — appears fast and healthy |
| P95 | 38 seconds | Acceptable for most transactional types |
| P99 | 11 minutes | Exceeds OTP expiry window — authentication failure |
| Average | 48 seconds | Looks acceptable in dashboard; hides the P99 problem entirely |
At 10,000 OTP sends per month, P99 represents 100 users per month experiencing authentication failures from tail latency alone — while average latency shows a reasonable-looking 48 seconds.
Average delivery speed matters less than worst-case authentication latency.
Latency SLOs by Email Priority Class
| Email Type | P50 Target | P99 Target | Failure Threshold | Consequence |
|---|---|---|---|---|
| OTP / MFA | Under 5 sec | Under 30 sec | Token expiry (5–10 min) | Authentication failure |
| Password Reset | Under 10 sec | Under 60 sec | Token expiry (15 min–24 hr) | Account lockout |
| Email Verification | Under 15 sec | Under 2 min | Session timeout or abandonment | Failed activation |
| Invoice / Billing | Under 5 min | Under 30 min | No hard expiry | Expectation mismatch |
| System Alert | Under 2 min | Under 10 min | Alert relevance window | Late notification reduces actionability |
How to Measure Email Latency Properly
Correct latency measurement requires tracking the full pipeline — not just the relay handoff. The relay’s acceptance timestamp is one data point in a multi-stage sequence. It is not the measurement that determines whether an OTP was useful.
Step 1 — Track SMTP Acceptance Time
SMTP acceptance time is the baseline: the gap between message submission and receiving server acknowledgment (250 OK). Most relay providers expose this via delivery event webhooks or API event logs. Log the difference between submission timestamp and delivery event timestamp. This measures relay performance and receiving server responsiveness — not queue wait time and not inbox arrival time.
Step 2 — Measure Inbox Arrival Time
True inbox arrival time requires seed list monitoring: test mailboxes at major ISPs (Gmail, Outlook, Yahoo, Apple Mail) polled automatically to record when a message first appears. Send test messages from production sending infrastructure every 15 to 30 minutes. Record the gap between send timestamp and inbox appearance timestamp. This captures ISP-side processing delays invisible to SMTP acceptance metrics and detects spam folder routing as a separate signal.
Step 3 — Monitor Queue Delay
Record a timestamp at message creation and another at worker pickup. The difference is queue wait time. Track this as a separate metric from SMTP acceptance time — different cause, different remediation. A queue delay spike that precedes an SMTP delivery spike confirms the bottleneck is internal, not ISP-side.
Step 4 — Analyze Retry Timing
Log all retry events with timestamps. Calculate accumulated retry wait time for each delivered message that required at least one retry. Alert when accumulated retry wait time for authentication-class email exceeds the SLO threshold. This distinguishes greylisting events (one retry after a single interval) from throttle events (multiple exponential backoff retries) from retry storms (many fixed-interval retries accumulating hours of added delay).
Step 5 — Compare P95/P99 Delivery Metrics
In Prometheus, record delivery latency as a histogram metric with labels for email type and recipient ISP domain. In Grafana, visualize P50, P95, and P99 as separate time series per email class. Configure alert rules that fire when P99 for authentication-class email exceeds the SLO threshold — not when average latency crosses a fixed value.
Step 6 — Separate ISP-Specific Delay Analysis
Tag delivery events with recipient domain. Aggregate P99 latency by ISP domain. Alert when P99 at a specific ISP diverges significantly from the cross-ISP baseline. A spike at gmail.com that does not appear at outlook.com indicates a Gmail-specific filtering or throttling event — a different diagnosis and a different remediation than a relay-wide latency increase.
The complete observability architecture for these measurements is covered in the SMTP monitoring tools for transactional email infrastructure guide.
Why SMTP Success Metrics Can Be Misleading
SMTP delivery success means the receiving server accepted responsibility for the message. It does not commit to any particular timeline for processing, filtering, or inbox placement. A message accepted in 2 seconds can sit in ISP-side processing queues for 7 minutes before reaching the inbox — and the relay dashboard will report both as identical successful deliveries.
By the time SMTP metrics showed degradation, the authentication flow had already failed.
Three Specific Dashboard Blind Spots
ISP-side processing delay: Every major ISP runs received messages through internal filtering and routing queues after SMTP acceptance. This delay varies by ISP load, sender reputation, and message characteristics. It is never reported back to the sending MTA. It exists entirely between the SMTP 250 OK and inbox appearance — invisible to any relay-side monitoring.
Application queue wait time: Messages that have not yet been handed to the relay do not appear in relay telemetry. An application that logs a message as “sent” when it is placed in the application queue is systematically underreporting delivery latency. The relay dashboard shows clean metrics because the relay only sees messages after they exit the queue.
Spam folder routing: Messages routed to the spam folder appear as successfully delivered in relay metrics. SMTP acceptance, 250 OK, delivery event complete — all correct from the protocol perspective. Only seed list testing catches this.
For a full analysis of why production email failures occur without visible SMTP error signals, the production email debugging guide covers the complete failure mode stack.
Observability and Monitoring Best Practices
Latency monitoring for transactional email requires instrumentation at layers relay dashboards do not cover. The stack below represents the minimum instrumentation for production SaaS authentication email.
Application Layer — Queue Wait Time
Message creation timestamp to worker pickup timestamp. Track as a histogram. Alert when P99 queue wait time for authentication-class email exceeds 30 seconds. This metric is invisible to every relay-side tool and is the earliest signal of the congestion pattern that causes most OTP latency incidents.
Relay Layer — Delivery Event Timestamps
SMTP acceptance timestamp from delivery event webhooks, per message. Record the gap between submission and acceptance. Alert when P99 relay processing time increases — this signals relay-side issues distinct from queue issues.
Retry Layer — Accumulated Retry Wait Time
Log each retry attempt timestamp and retry count per message. Compute accumulated retry wait time for delivered messages that required retries. Alert when the accumulated retry time for authentication-class email exceeds 60 seconds — indicating a retry pattern (fixed interval under throttling) that is adding avoidable latency.
Inbox Layer — Seed List Testing
Automated seed list inbox placement and latency tests every 30 minutes from production sending infrastructure. Record SMTP acceptance time and inbox appearance time separately per ISP. Alert when inbox arrival time at any ISP exceeds the P99 SLO threshold, or when inbox placement drops below 90%.
ISP-Side Reputation Signals
Configure Google Postmaster Tools for the production sending domain. Domain reputation declining from High to Medium precedes increased filtering aggressiveness — which adds to ISP-side processing latency — by days or weeks. This is the leading indicator that most teams miss because they are not watching it. Configure Microsoft SNDS for ISP-specific signals at Outlook.
For bounce rate management practices that keep sender reputation healthy and reduce ISP-side latency from increased filtering, the email bounce rate reduction guide covers the operational framework.
Incident Snapshot: OTP Failure During Traffic Spike
No messages failed delivery. Every SMTP metric was healthy throughout. The monitoring system never triggered an alert.
Context: A SaaS product ran a promotional campaign that drove 2,400 new sign-ups over a 3-hour window — approximately 6x the typical hourly rate. Every sign-up triggered an email verification OTP with a 5-minute expiration window. The email queue worker pool was sized for typical load: 4 workers, 18 messages per minute combined throughput.
T+0: Sign-up volume begins exceeding worker throughput. Queue starts accumulating.
T+20 min: Queue depth reaches 540 messages. Workers processing at 18/minute; new OTPs entering at 45/minute. Delivery time for newly generated tokens: 30 minutes of queue wait — 25 minutes past OTP expiry.
T+20 to T+45: Users who signed up at T+0 tap “resend.” Each resend generates a new OTP queued behind the existing backlog. The resend button doubled queue pressure during the incident. Original OTPs and resent OTPs are both in queue; both will arrive expired.
T+45 min: First OTPs from T+0 begin delivering. Tokens expired 40 minutes ago. Users attempt verification, receive “OTP expired” errors.
What every dashboard showed: Relay: 100% delivery success. Application: no errors. Queue monitoring: not configured. Support tickets: 18% of sign-ups from the campaign window could not complete verification.
The signal that was available at T+5 and went unread: Queue wait time for authentication-class messages, already at 8 minutes and climbing. An alert on queue wait time exceeding 60 seconds would have fired before the first OTP expired.
Operational lesson: Queue depth monitoring on the relay does not catch application-layer queue incidents. The relay never saw the congestion because the messages were still waiting in the application queue. Most queue incidents begin upstream of the relay.
How PhotonConsole Reduces Latency Risk
The core instrumentation gap in production email latency is between SMTP acceptance events — which relays log natively — and inbox arrival time, which requires separate tracking. Most relay integrations expose aggregate success metrics. Diagnosing a latency incident requires per-message event data: acceptance timestamp, retry attempt timestamps, response codes, and the accumulated retry wait time that explains why a message with a 2-second SMTP handshake arrived 11 minutes after generation.
PhotonConsole’s SMTP relay exposes delivery telemetry at the message level — SMTP acceptance time, retry count and intervals, response code per attempt, and per-message delivery timestamps. This is the raw data that makes P95 and P99 percentile calculation possible across email priority classes without building a custom logging layer on top of the relay.
The relay prioritizes authentication-class sends — OTPs and password resets — in a separate processing lane from bulk and lifecycle sends. During volume spikes, a marketing lifecycle campaign send does not delay authentication email in the same queue. That queue isolation is the infrastructure mechanism; whether it solves a specific team’s incident depends on where their bottleneck actually is.
Pay-per-use pricing eliminates the incentive to stay on lower-tier plans with rate limits that create throttling at launch-day burst traffic — the conditions that produced the incident described above.
Email Latency Monitoring Checklist
| Signal | What It Indicates | Recommended Action |
|---|---|---|
| Rising application queue depth, relay metrics normal | Application-layer congestion — worker capacity exceeded; relay is not receiving messages yet | Increase worker concurrency; implement priority queues by email class; alert on queue wait time per priority |
| Deferred relay queue growing, active queue stable | ISP throttling or relay rate limit — receiving servers returning 4xx temporaries | Verify exponential backoff in retry logic; check plan rate limits against peak volume |
| P99 latency spike for authentication email | Tail latency events causing OTP delivery past token expiry | Correlate with queue depth and retry timing at spike timestamps; investigate worker capacity first |
| P99 spike isolated to specific ISP domain | ISP-specific filtering or throttling | Check Postmaster Tools or SNDS for the affected ISP; review domain reputation signals |
| 451 responses in delivery logs | Greylisting — receiving server requiring retry after interval | Verify retry honors greylist intervals; monitor time-to-delivery for greylisted messages against OTP expiry |
| 421 responses in delivery logs | Rate limiting at relay or receiving server | Implement exponential backoff; reduce connection rate; verify plan rate limits |
| Fixed-interval retry pattern under throttling | Retry storm — fixed intervals re-trigger rate limit continuously | Switch to exponential backoff; cap retry window for OTP/authentication class at 2 minutes |
| Inbox latency diverging from SMTP acceptance latency | ISP-side internal processing delay after acceptance | Monitor via seed list testing; check Postmaster Tools domain reputation for filtering signals |
| P50 stable, P99 spiking | Tail latency events affecting a consistent subset — likely greylisting or ISP throttling for a portion of sends | Analyze retry logs for messages in P99 range; check whether affected messages share common recipient domain |
| Support tickets about expired OTPs, no bounce events | Latency-driven delivery failures — OTPs delivered after expiry with no SMTP failure generated | Check application queue wait time immediately; this pattern almost always indicates queue congestion, not relay failure |
Frequently Asked Questions
What is transactional email latency?
The total elapsed time between email generation in the application and inbox arrival at the recipient — including application queue wait, MTA processing, SMTP relay transit, DNS resolution, ISP filtering, and any retry delays. Not SMTP acceptance time, which measures only the relay handoff and excludes the stages most likely to cause user-visible delays in production.
Why do OTP emails arrive late?
Five causes in order of frequency: application-level queue congestion where workers cannot keep pace with traffic volume; relay rate limits exceeded, triggering a retry storm that holds the queue congested long after the initial spike; greylisting by receiving servers that requires a 5–30 minute retry interval; shared relay infrastructure contention from co-tenant bulk sends; retry misconfiguration where fixed-interval retries amplify rather than resolve transient failures. The first cause — queue congestion — is the most common and the least visible, because it produces zero SMTP errors and appears nowhere in relay dashboards.
What is acceptable email latency for SaaS?
Depends entirely on email type. For OTP and MFA: P99 under 30 seconds — well within the 5–10 minute token expiry window. For password reset: P99 under 60 seconds. For email verification: P99 under 2 minutes. For billing notifications: P99 under 30 minutes. These are SLO targets, not averages. Average latency for authentication email is the wrong metric — P99 determines whether the authentication system is reliable for all users, not just the majority.
What is P95 vs P99 email latency and which should I track?
P95 is the delivery time within which 95% of messages arrive. P99 is the delivery time within which 99% arrive. For authentication email, track P99. At 10,000 OTP sends per month, P99 represents 100 users per month experiencing the worst-case delivery time. If P99 exceeds the token expiry window, the system is producing authentication failures for those users — regardless of how good P50 looks.
How do I troubleshoot SMTP email latency?
First: check application-level queue wait time — the delay between message creation and MTA handoff. If elevated, the bottleneck is internal. Second: check relay delivery event logs for 4xx responses adding retry wait time. Third: compare SMTP acceptance time with seed list inbox arrival time — if inbox time significantly exceeds acceptance time, the latency is in ISP-side processing. Finally: compute P99 separately per email priority class and compare against SLO thresholds defined by token expiry windows. The email delivery delay diagnosis guide covers active incident diagnosis for each of these patterns.
How do I monitor email delivery speed in production?
Four layers: application queue wait time (creation to worker pickup timestamp); SMTP relay delivery event timestamps with per-message logging; P95 and P99 percentile computation in Prometheus with SLO-threshold alerting by email class; and seed list inbox testing every 30 minutes capturing true time-to-inbox including ISP-side processing. Google Postmaster Tools provides domain reputation signals that often predict latency increases before delivery events show them.
Conclusion
Transactional email latency is a reliability metric. The framing that matters: an OTP that arrives after expiry is not a slow OTP — it is a broken authentication flow that the relay successfully completed. SMTP success metrics record the relay’s behavior. They do not record the user’s experience.
Tail latency usually appears before outright delivery failure. The P99 spike comes before the delivery rate drops. The queue depth climbs before users report problems. The monitoring that catches these signals — queue wait time per priority class, P99 latency per email type, seed list inbox arrival timing — exists independently of relay-provided dashboards. It has to be built.
Latency incidents are visible in queue telemetry long before they appear in support tickets. The teams that monitor delivery timing find failures in metrics. The teams that monitor only SMTP success find them from users.
For teams building the bounce management and reputation infrastructure that reduces ISP-side filtering latency, the email bounce rate reduction guide covers the reputation practices that keep sender reputation healthy. For teams evaluating SMTP relay infrastructure with the delivery telemetry this guide describes, PhotonConsole provides the message-level event visibility that makes P99 latency monitoring possible without a custom instrumentation layer.
Recommended Infrastructure Guides
Latency Diagnosis and Debugging
- Email delivery delays — infrastructure-level diagnosis
- Transactional emails failing in production — debugging guide
- SMTP response codes — complete reference
Monitoring and Observability
- SMTP monitoring tools for transactional email infrastructure
- Email infrastructure checklist for SaaS products before launch
Deliverability and Reputation

SMTP Retry Logic Explained For Transactional Email Systems | Photonconsole.com
May 15, 2026[…] Transactional Email Latency Explained for SaaS Applications […]
Transactional Email Queue Architecture Explained | Photonconsole.com
May 15, 2026[…] Transactional Email Latency Explained for SaaS Applications […]
Postmark Alternatives: An Infrastructure-Level Guide For Engineering Teams (2026) | Photonconsole.com
May 15, 2026[…] Email Latency in SaaS Applications […]